Getting Started with AI Recorder
The AI Recorder in BlinqIO lets you create automated tests quickly by recording user actions, generating Playwright code, running the tests, and viewing detailed reports.
Before You Begin
- Create a BlinqIO account and sign in.
- Install the latest version of BlinqIO Editor on your system.
- Install Visual Studio Code to view generated code on your system.
The Demo Application
Begin by using the AI Recorder to record a Shopping Cart test on our demo shopping website. If you're familiar with the AI Recorder, you can test your own application.
The demo shopping website includes login, product, cart, and checkout pages.
Create a New Project
Start by creating a new project in BlinqIO before recording any tests.
Go to the BlinqIO Onboarding page and choose one of the following options:
Check Use a Demo App to start with a sample application.
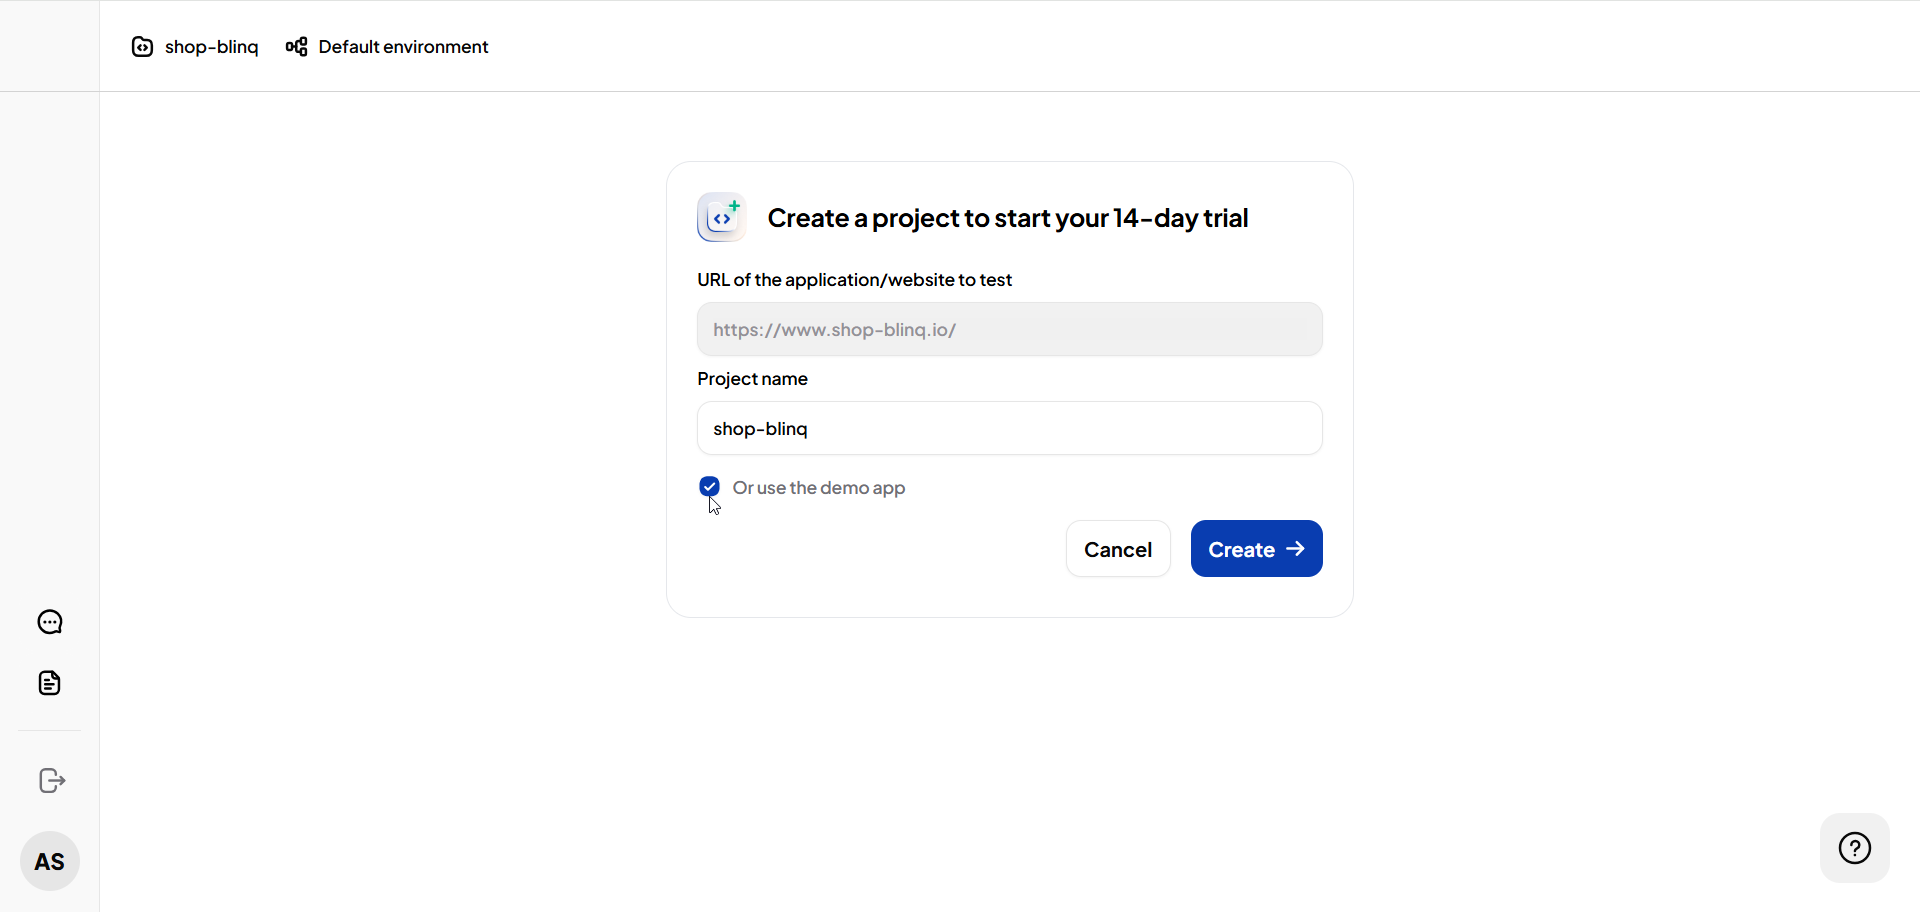
Enter your own URL in the provided field to use your application.
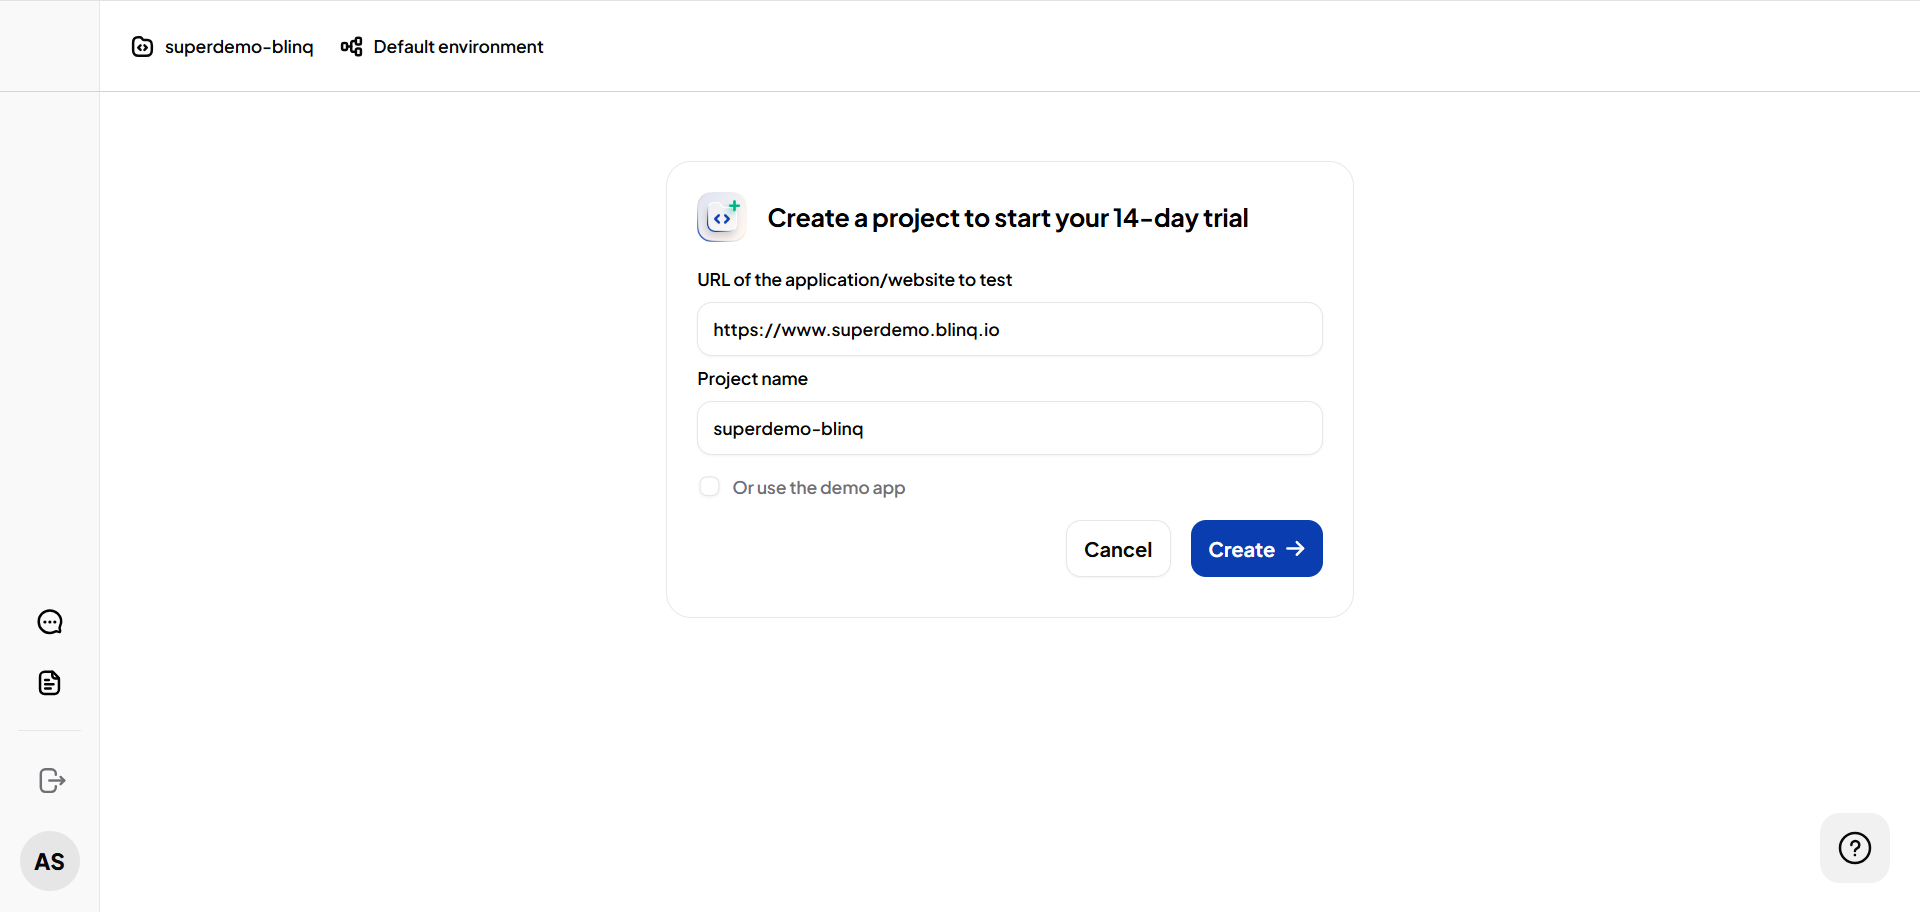
Enter a Project Name. A default name is suggested, which you can edit.
Example
BlinqIO Demo
Click Create to be redirected to the Dashboard.

This operation takes about 30 seconds. Once complete, a new BlinqIO project is created for the demo shopping website, and you are redirected to the Dashboard page.
Launch AI Recorder
Follow these steps to launch the AI Recorder:
Open the BlinqIO Editor on your system and click on Go to Features tab.
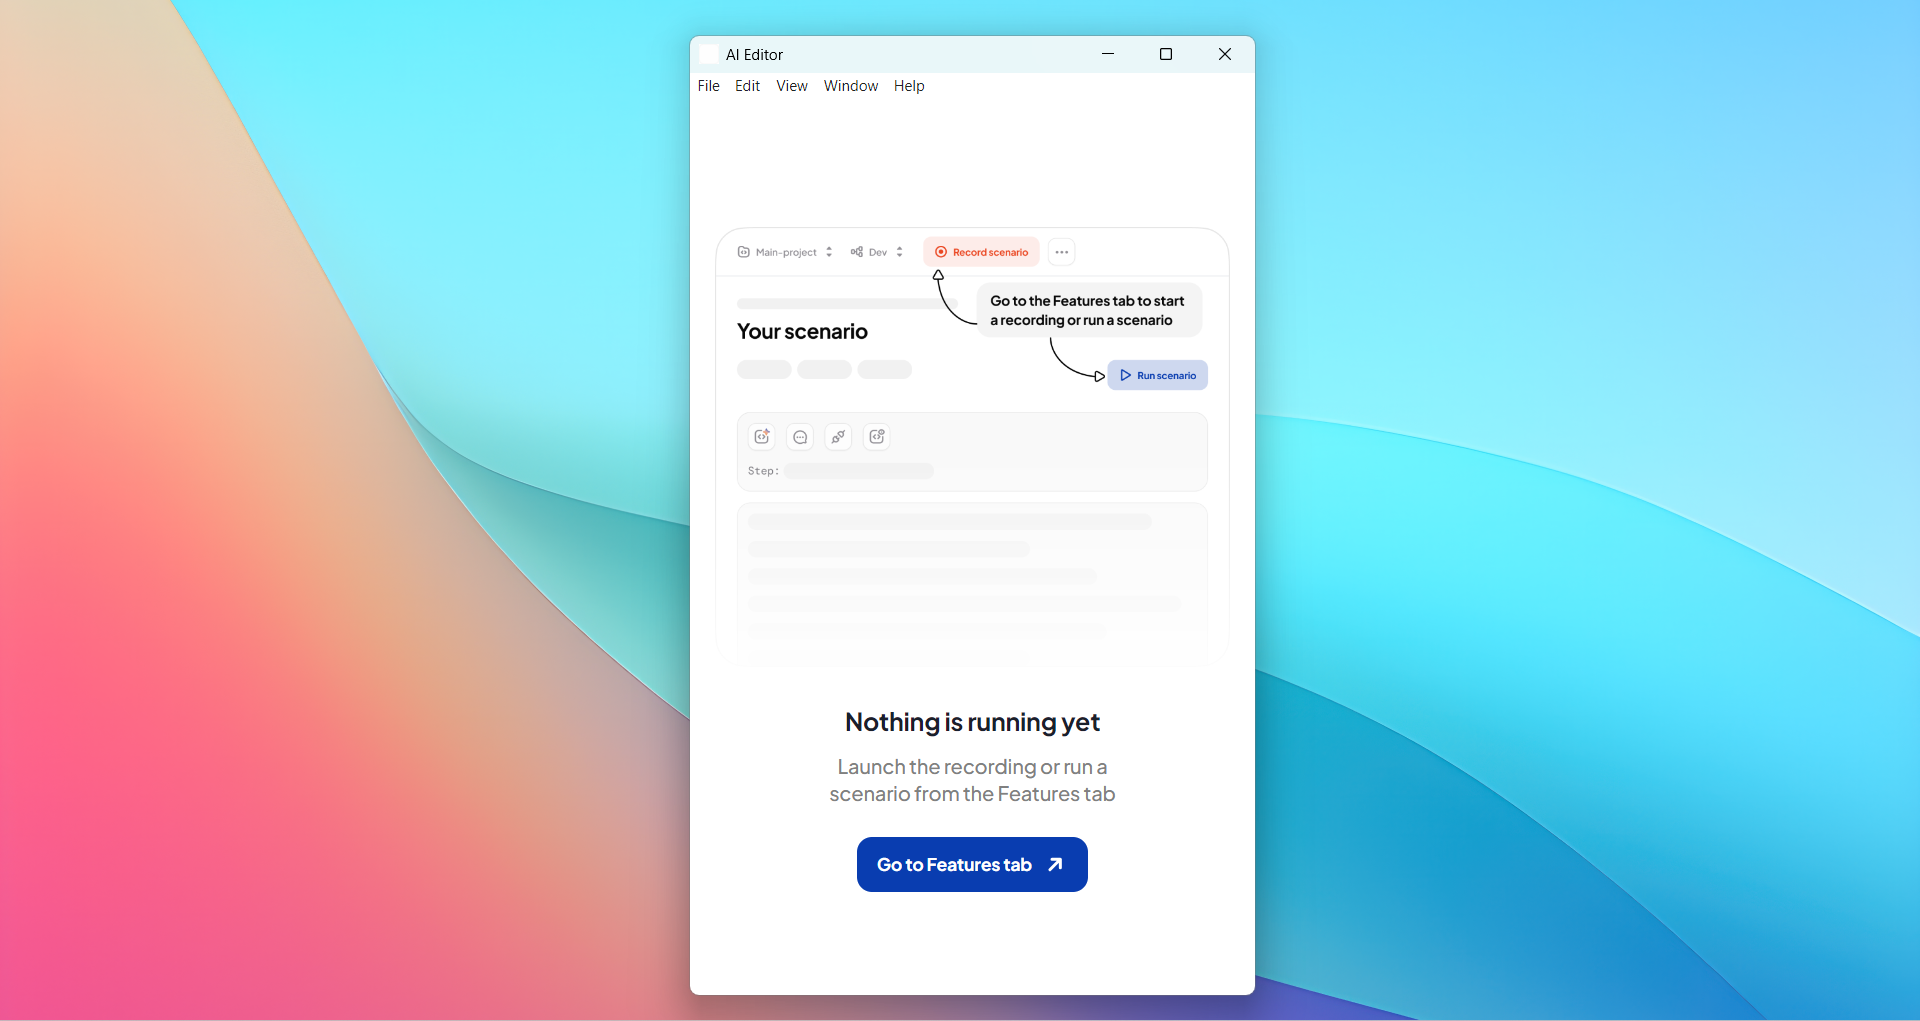
Go to your BlinqIO account and click Record Scenario to begin the recording setup.

Record your test scenario locally using the BlinqIO Editor. This is ideal for testing private or locally hosted applications.
If the Editor is not installed, click Download editor.
TIP
Refer to the Installation Guide for installation steps.
Once installed, click Start recording.

The BlinqIO AI Recorder launches alongside a Chromium window with the application under test (https://www.shop-blinq.io).
Note
Launching the Recorder may take 1–2 minutes, depending on your network speed.
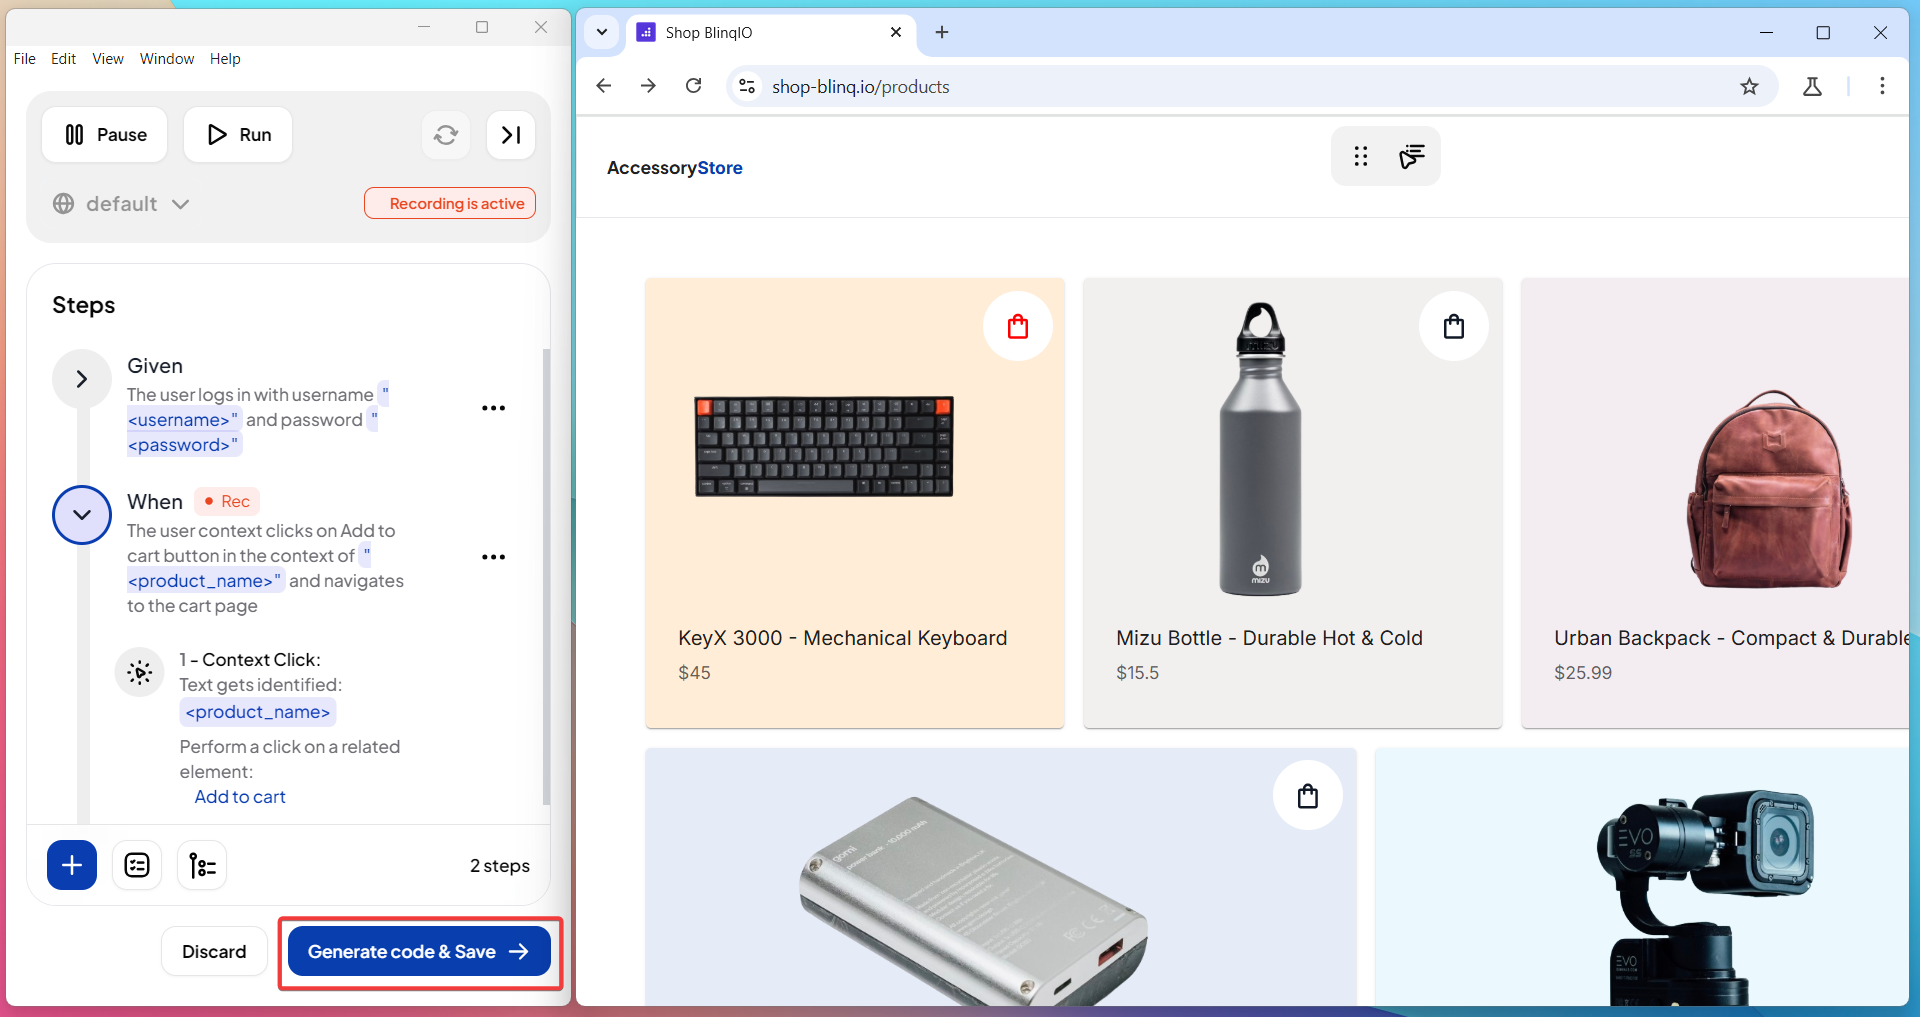
Start Recording Test Steps
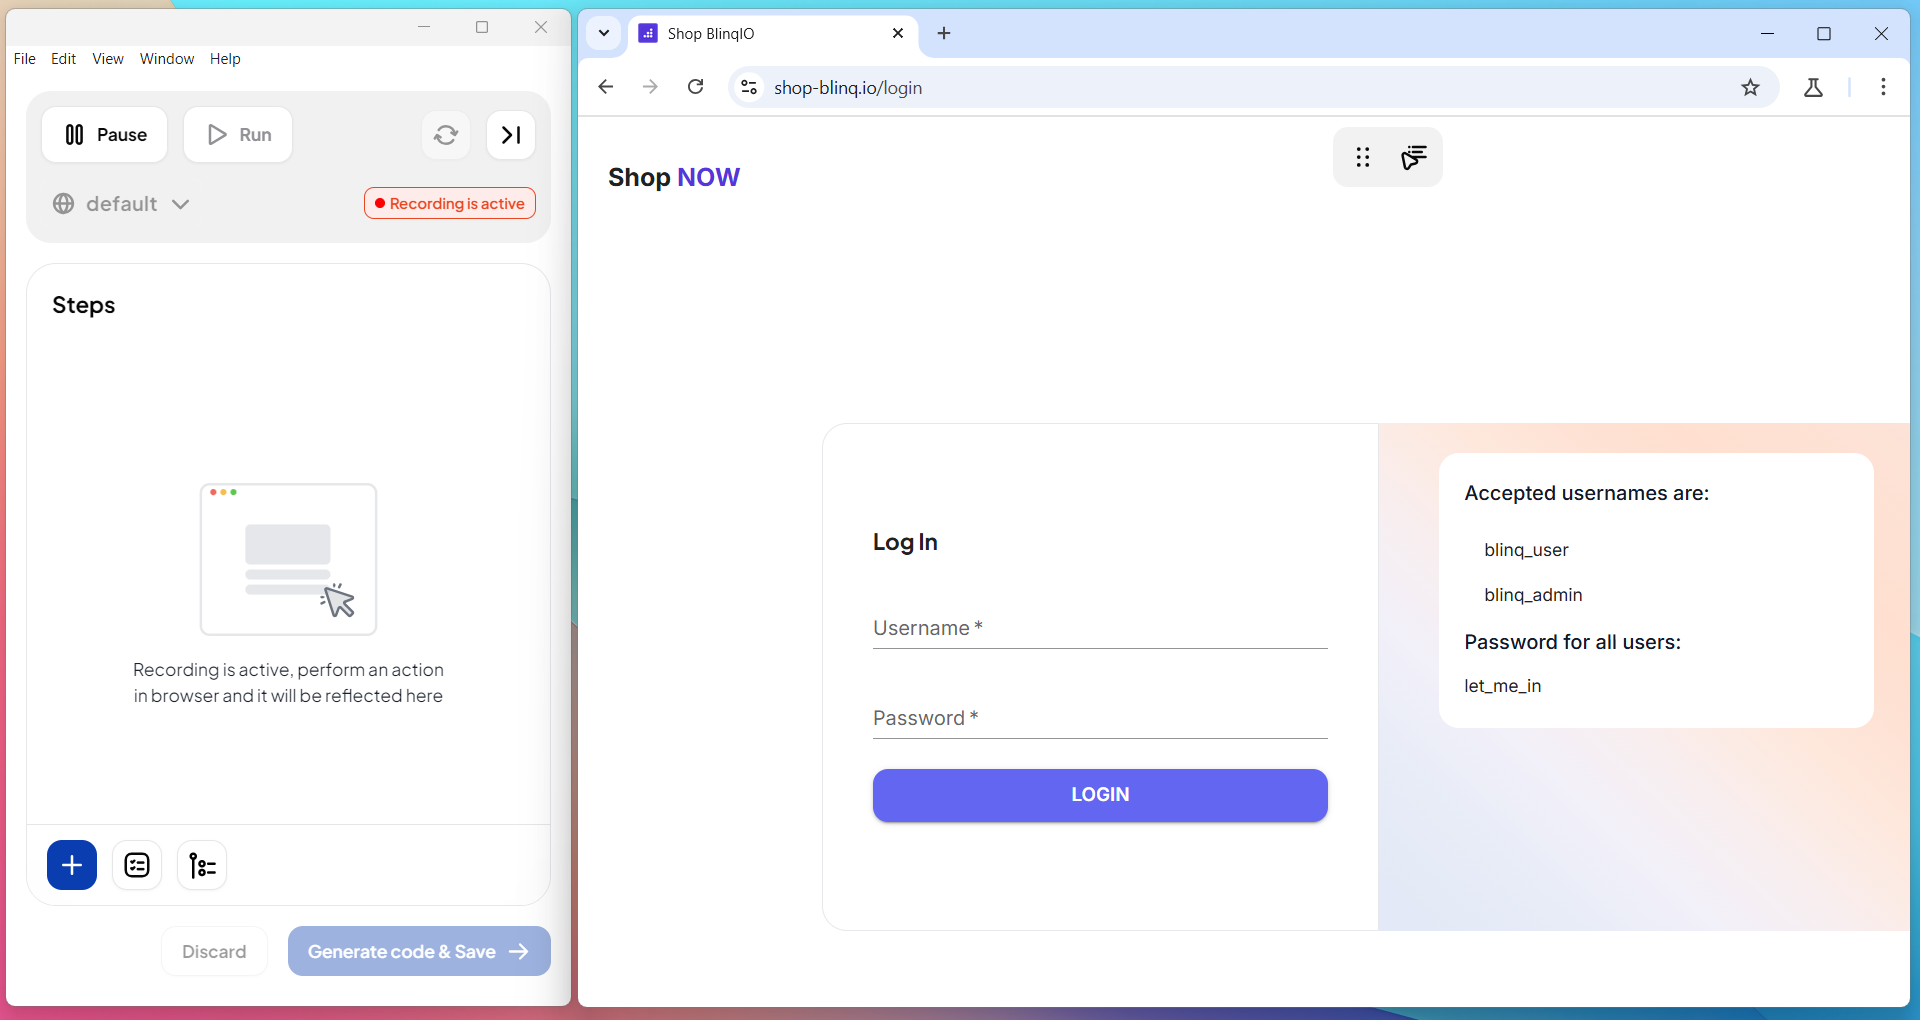
The AI Recorder launches in Recording Mode by default and begins capturing your actions on the demo shopping website.
As you interact with the site, the AI Recorder automatically logs each action and builds a structured test scenario.
Perform the following test steps on the shopping website:
1. Login with username blinq_admin and password let_me_in.
2. Add products to the cart.
3. Go to the cart page.
4. Select Checkout.
5. Fill out the Shipping Details form.
6. Log out of the shopping website.
Note
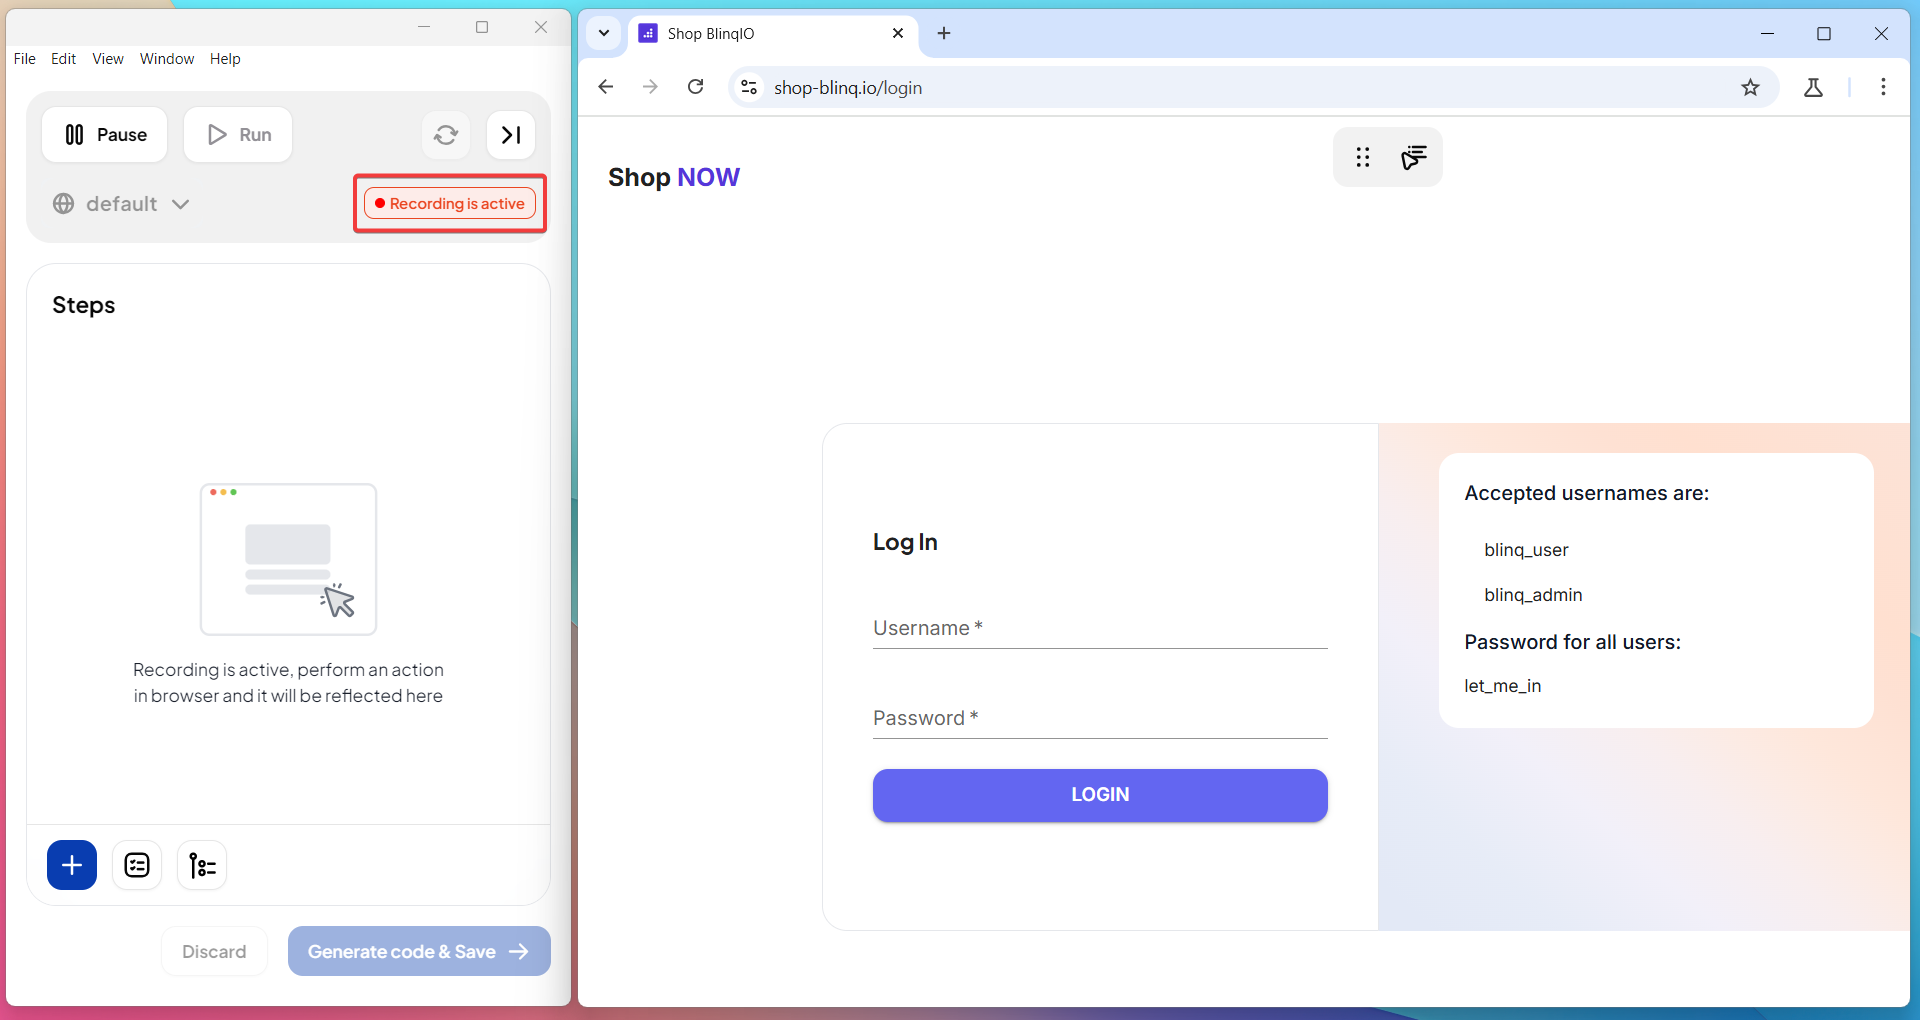
Ensure the Recorder is active before you perform any steps. You can pause and resume recording at any point.
Generate Code & Save
After recording the test steps, click Generate code & Save to begin saving your scenario.
Enter a Feature Name and Scenario Name, then click Continue to proceed.
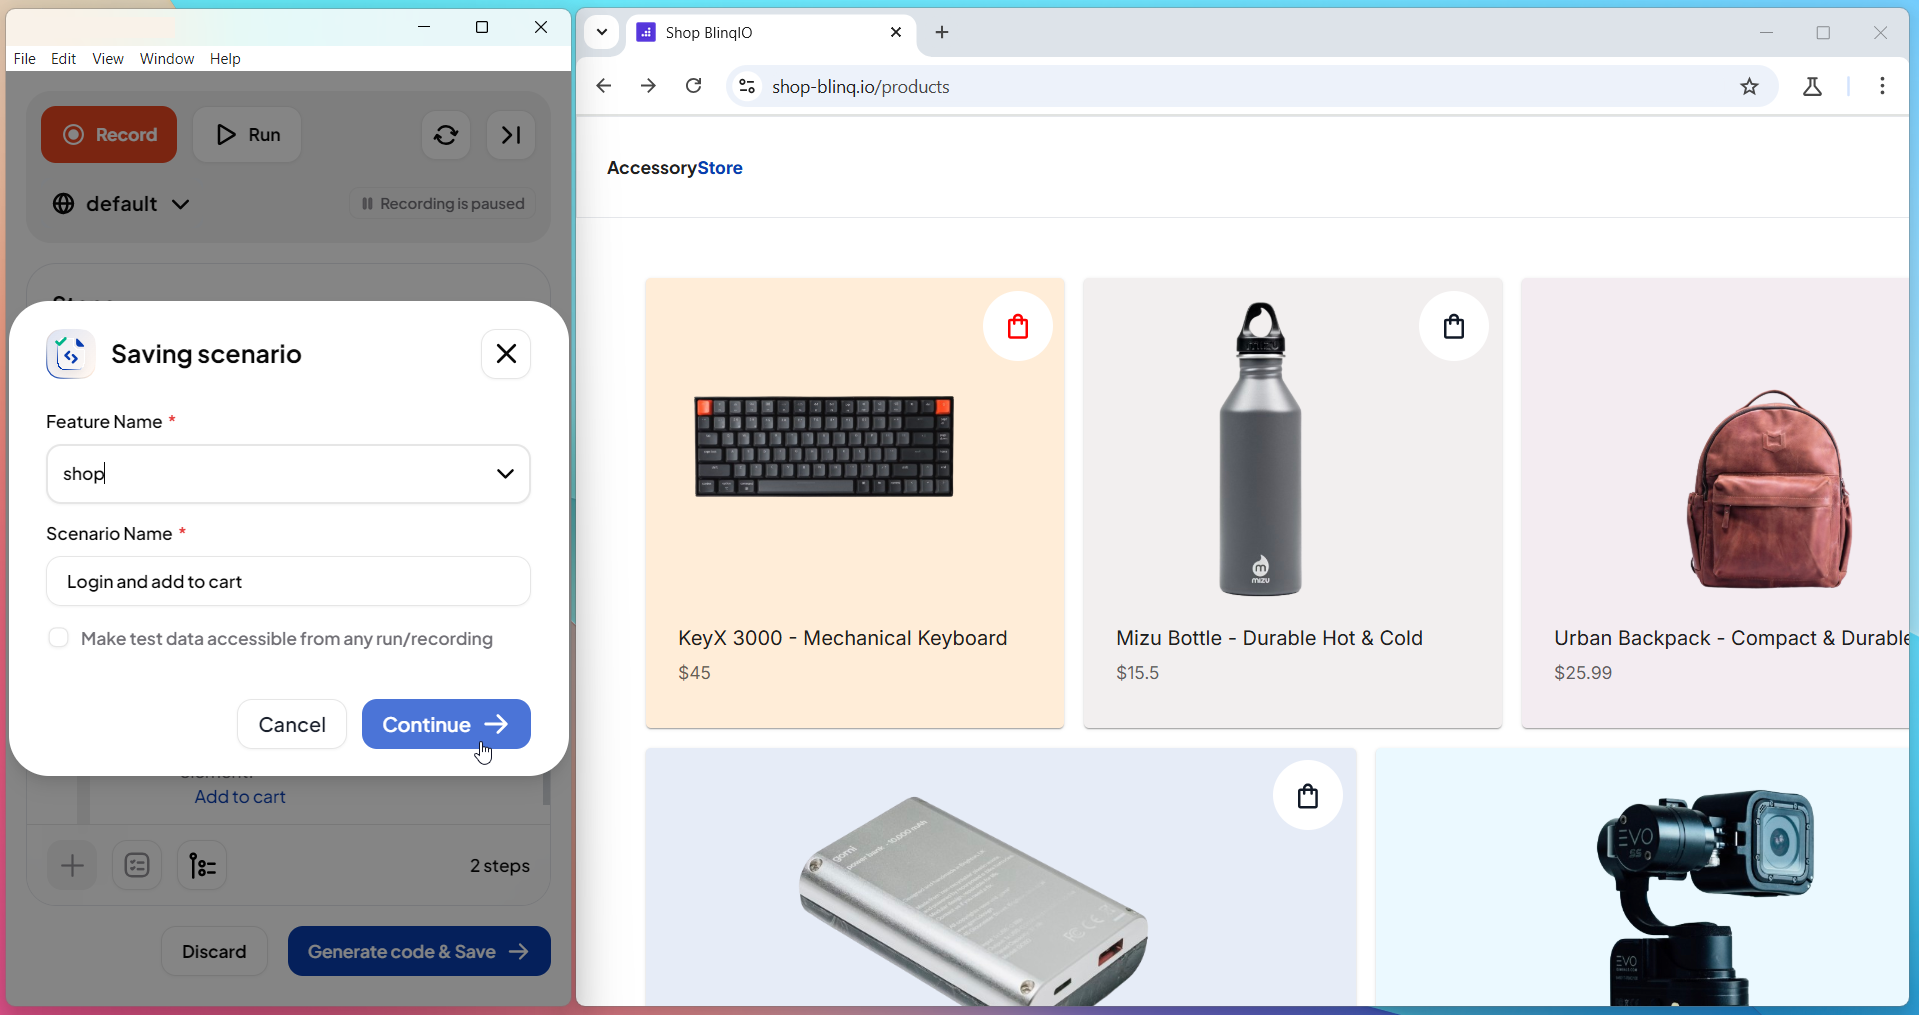
NOTE
The AI suggests default names that you can edit before continuing.
Choose how to view the generated test:

View Code in VS Code: Opens the generated code in Visual Studio Code.

Not working?
Ensure the
codecommand is added to your PATHView Scenario in BDD Gherkin format: Opens the generated Gherkin Scenario in your BlinqIO account.

Note
The code and Gherkin scenario are automatically synced with your BlinqIO account.
After viewing the code, you can either Run Scenario or start a New Recording.
Run Test
After saving your scenario, you can run it directly from your BlinqIO project.
Run the Shopping Cart test by completing these steps:
Go to the Features page in your BlinqIO account. This is the same page where you previously viewed the generated scenario.

Click Run Scenario to open the application launch window.

In the launch window, click Run scenario. This opens the BlinqIO Editor and executes your test in a new browser window.
NOTE
After the test completes, the BlinqIO Editor console displays this message:
Command finished, you can exit this window...
View Reports
BlinqIO automatically generates rich test reports after each run, including:
- Step-by-step execution details
- Screenshots per step
- Run duration and status
- Environment and test data
- Console and network logs
Open your test report by following these steps:
In the Editor console, click the Report link displayed after the test run.

Click on the scenario to open its detailed view.

Click on a step to expand it and view its actions. Screenshots for each actions are available on the right side.

Additionally, you can access Console and Network logs for deeper insights and debugging.