Skip to content
We've launched a comprehensive analytics dashboard for your BlinqIO projects with two dedicated metric views:
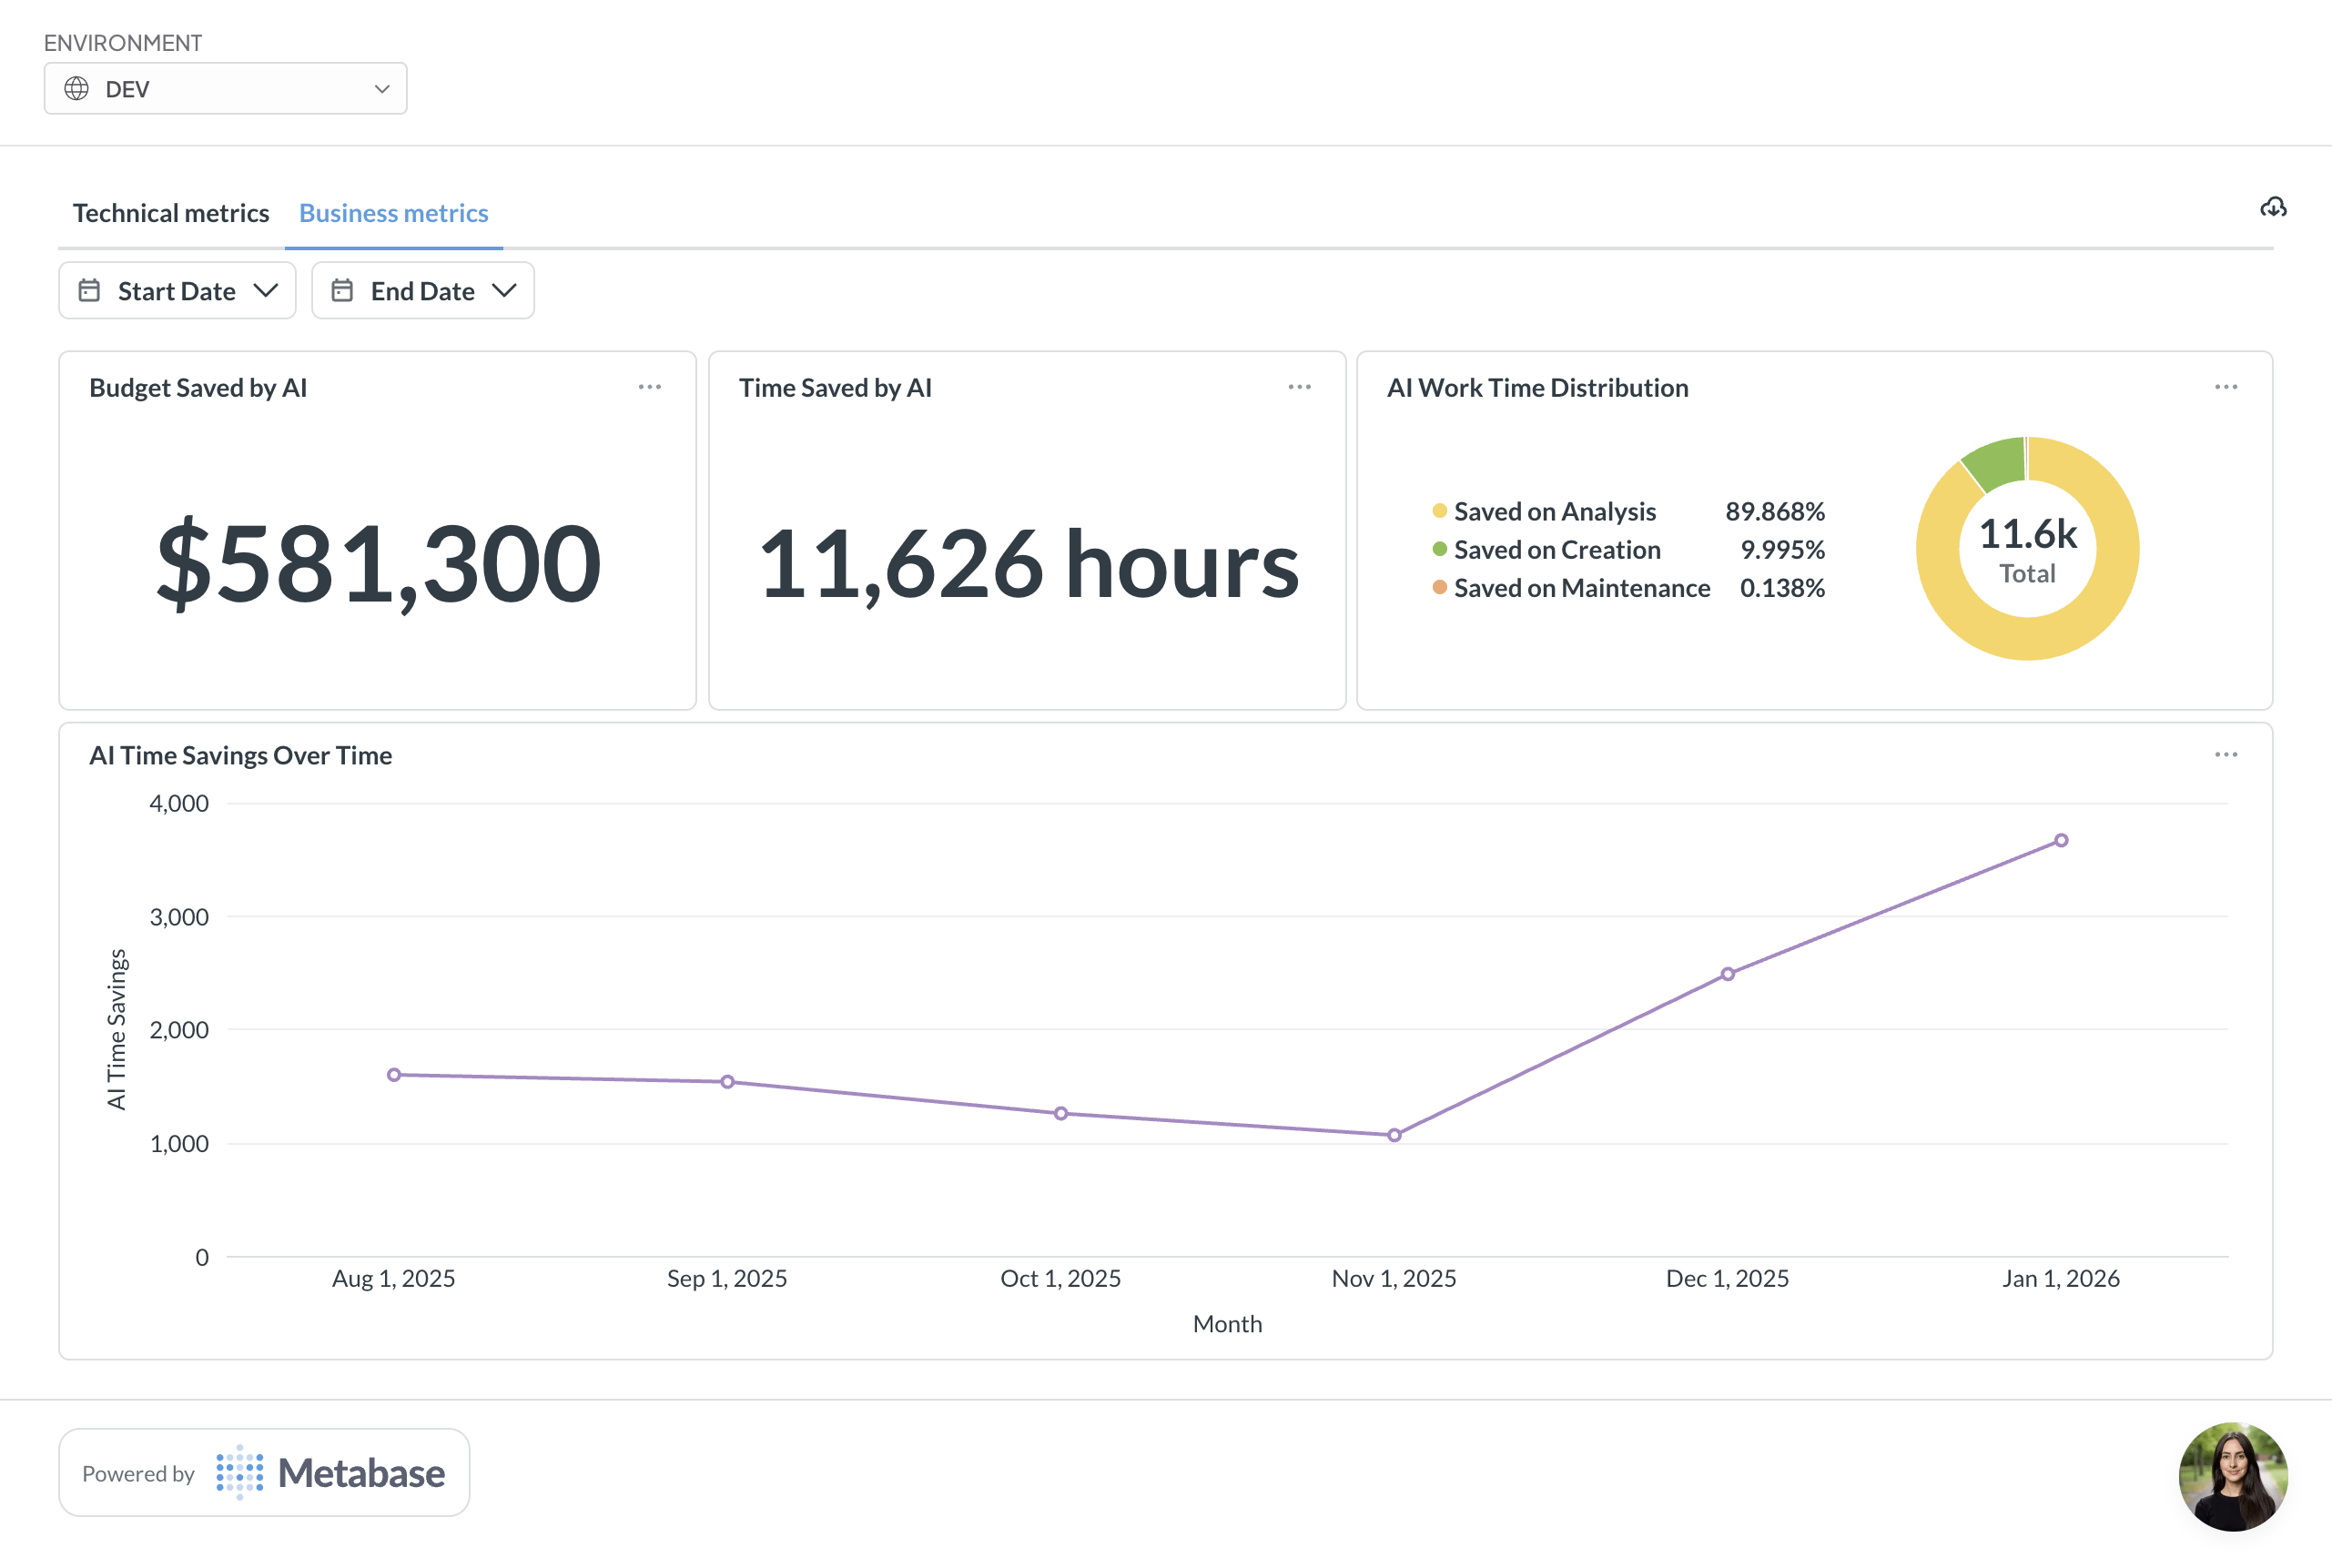
Business Metrics:
- Budget Saved by AI - total cost savings from AI Test Engineer
- Time Saved by AI - hours saved through automated processes
- AI Work Time Distribution - breakdown showing percentage saved on Analysis Test Creation, and Test Maintenance.
- AI Time Savings Over Time - trend chart visualizing savings growth across months
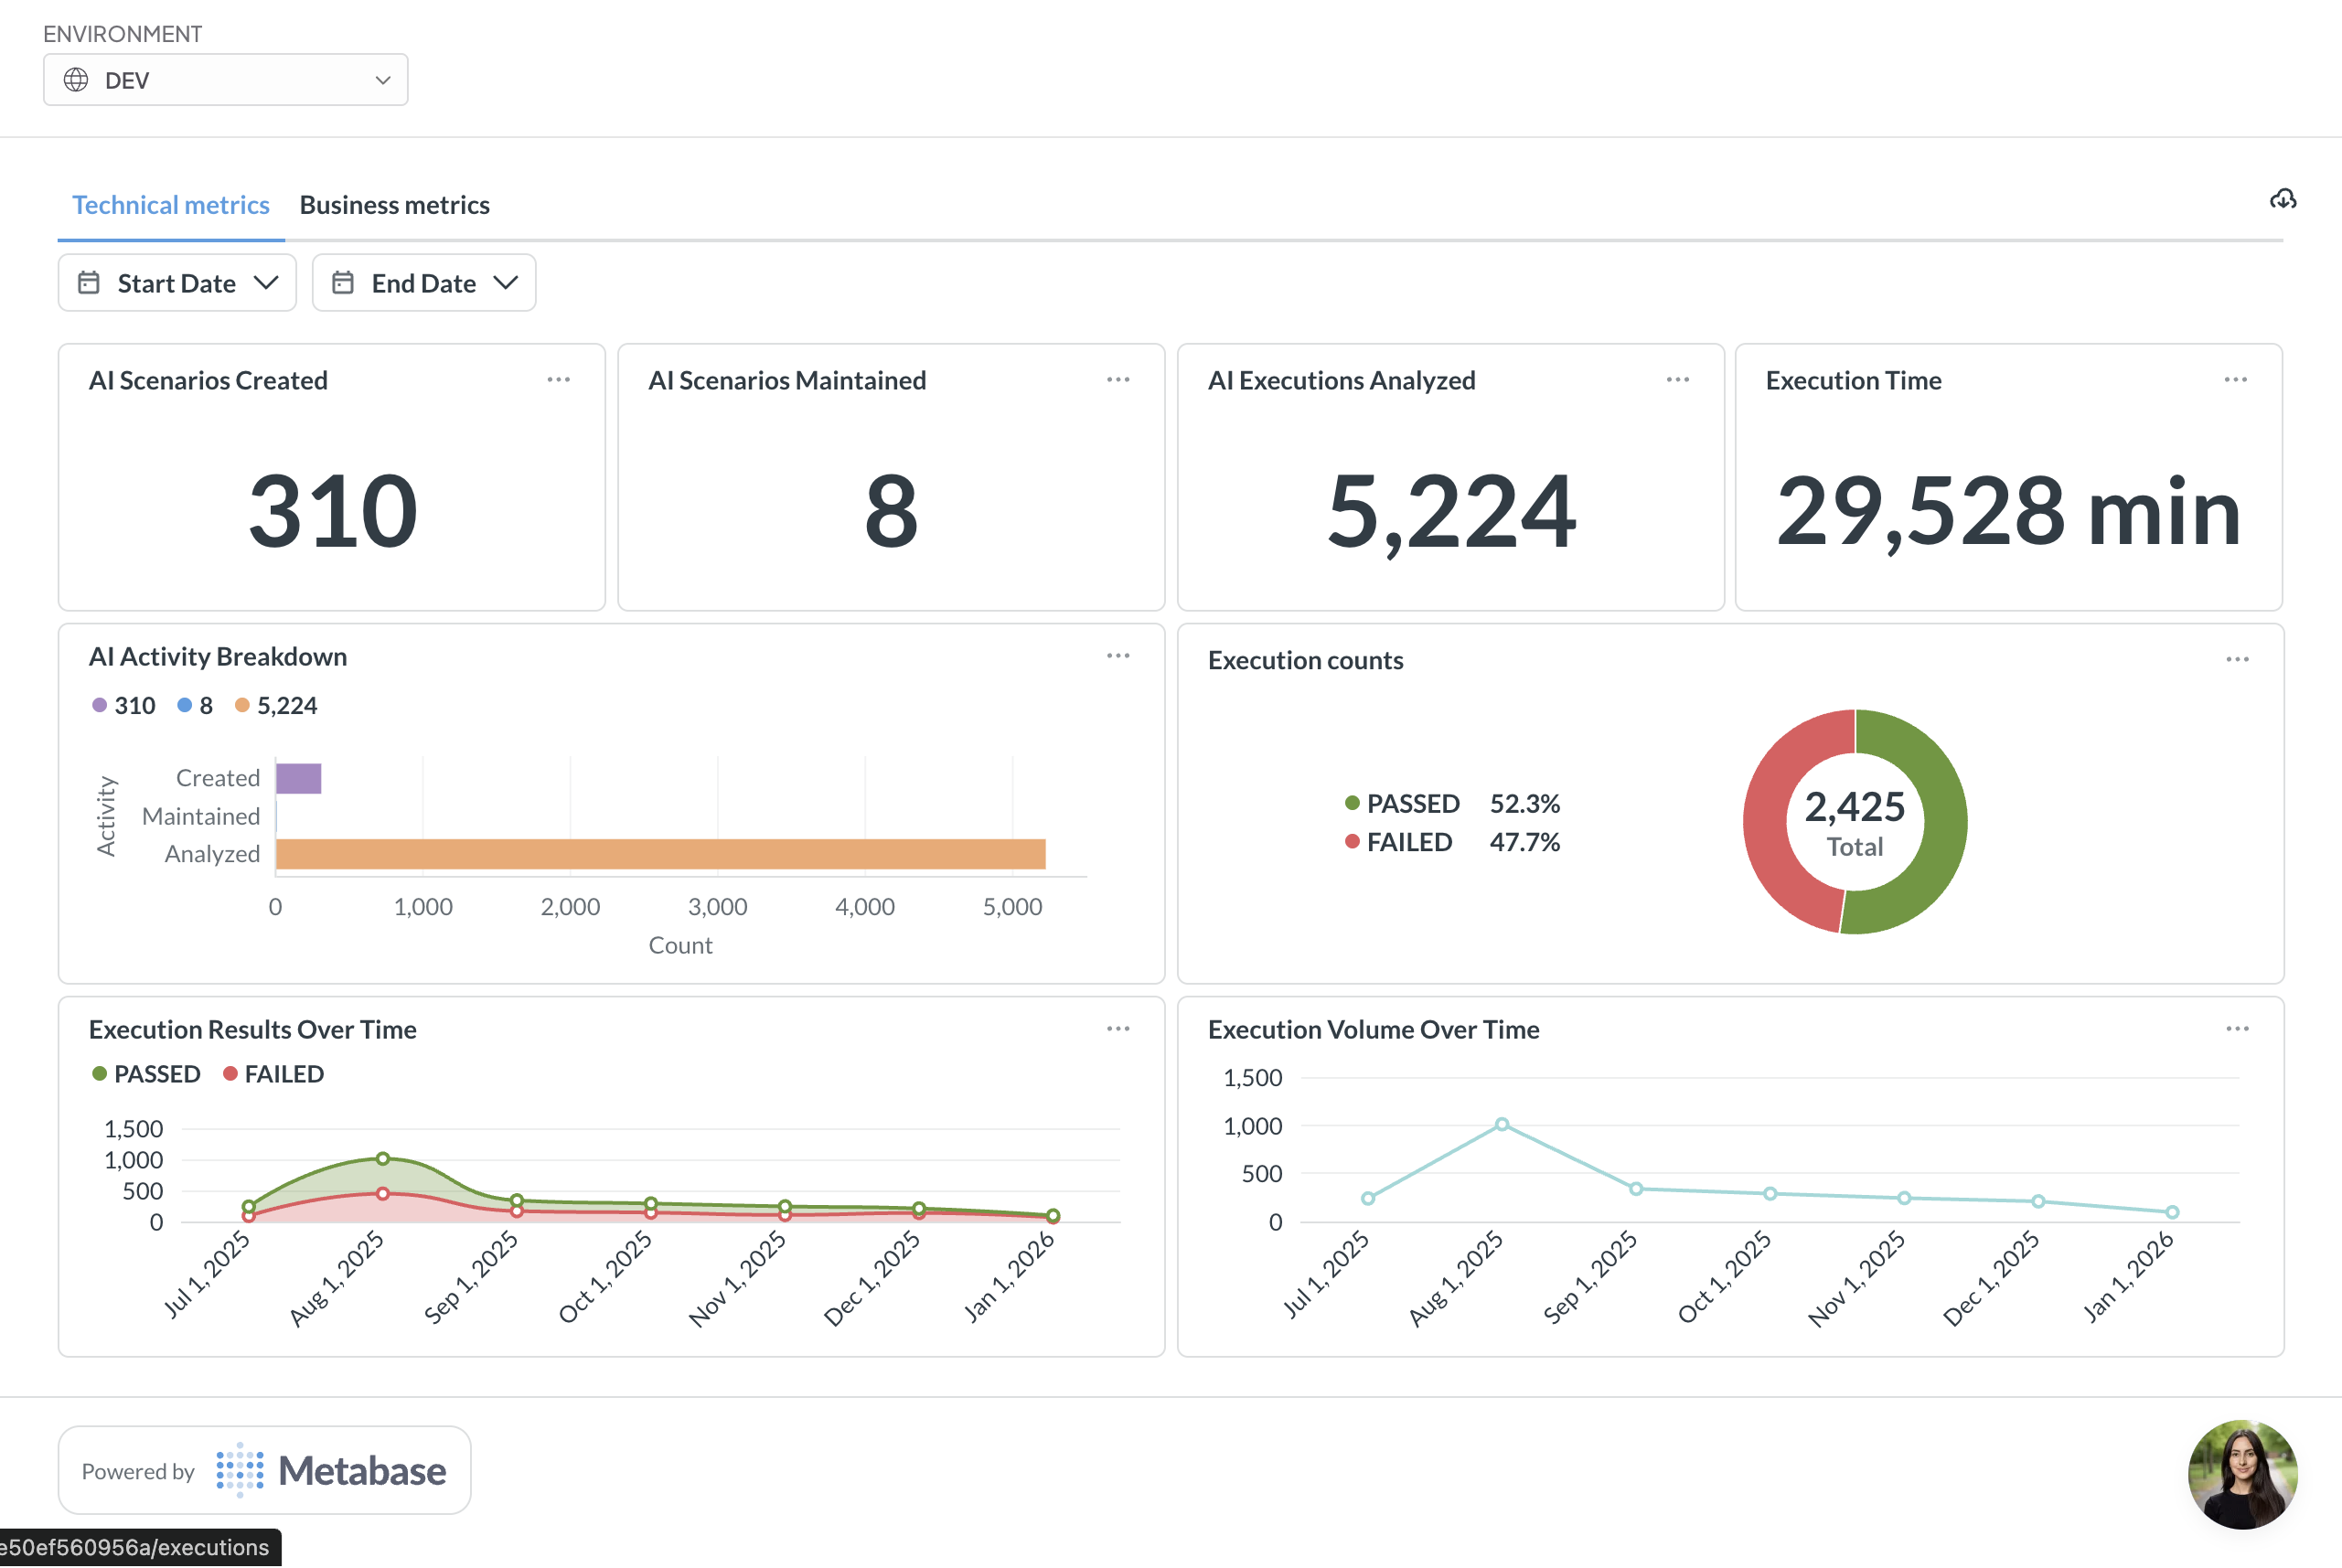
Technical Metrics:
- AI Scenarios Created - total count of created test scenarios
- AI Scenarios Maintained - number of scenarios under maintenance
- AI Executions Analyzed - total execution analysis count
- Execution Time - total time spent on test executions
- AI Test Engineer Activity Breakdown - horizontal bar chart showing distribution across Created, Maintained, and Analyzed tests
- Execution counts - donut chart displaying pass/fail rates with percentages
- Execution Results Over Time - line graph tracking passed vs failed executions by month
- Execution Volume Over Time - trend chart showing execution activity patterns
Visit the Dashboard page now to see the technical and business metrics for your project!